How to see why a check failed in GuardYak
An alert tells you something is down; the dashboard tells you what kind of down. GuardYak shows the status code, a plain-English explanation and how long the incident has been open, so you can decide who to call.
Before you start
- A check that has failed at least once
Plays silently with captions; the narrated version is on its way.
Transcript
When an alert arrives, see what failed, what the error means, and how long it's been happening.
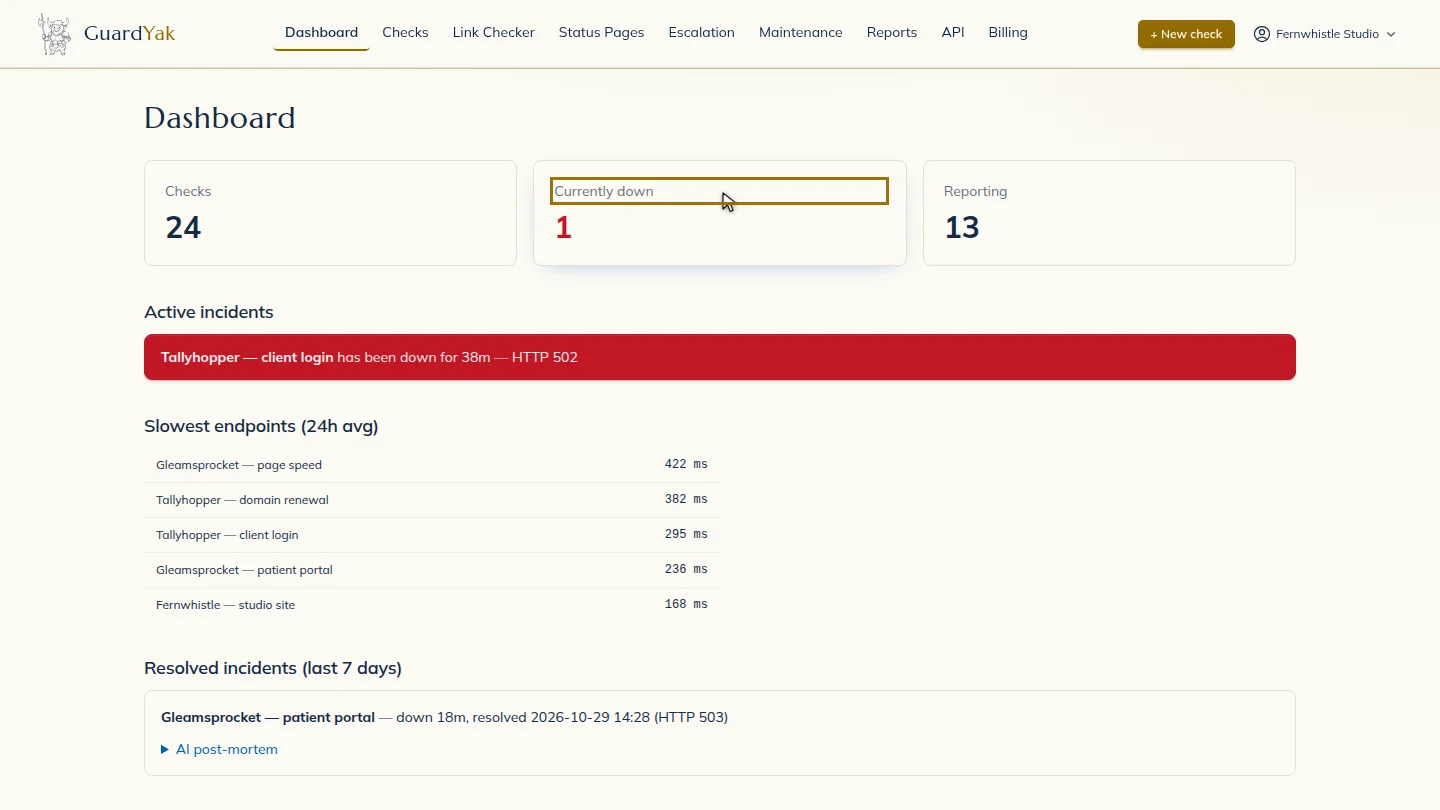
Open the Dashboard. The cards at the top show how many checks are down right now, and how many incidents are open.
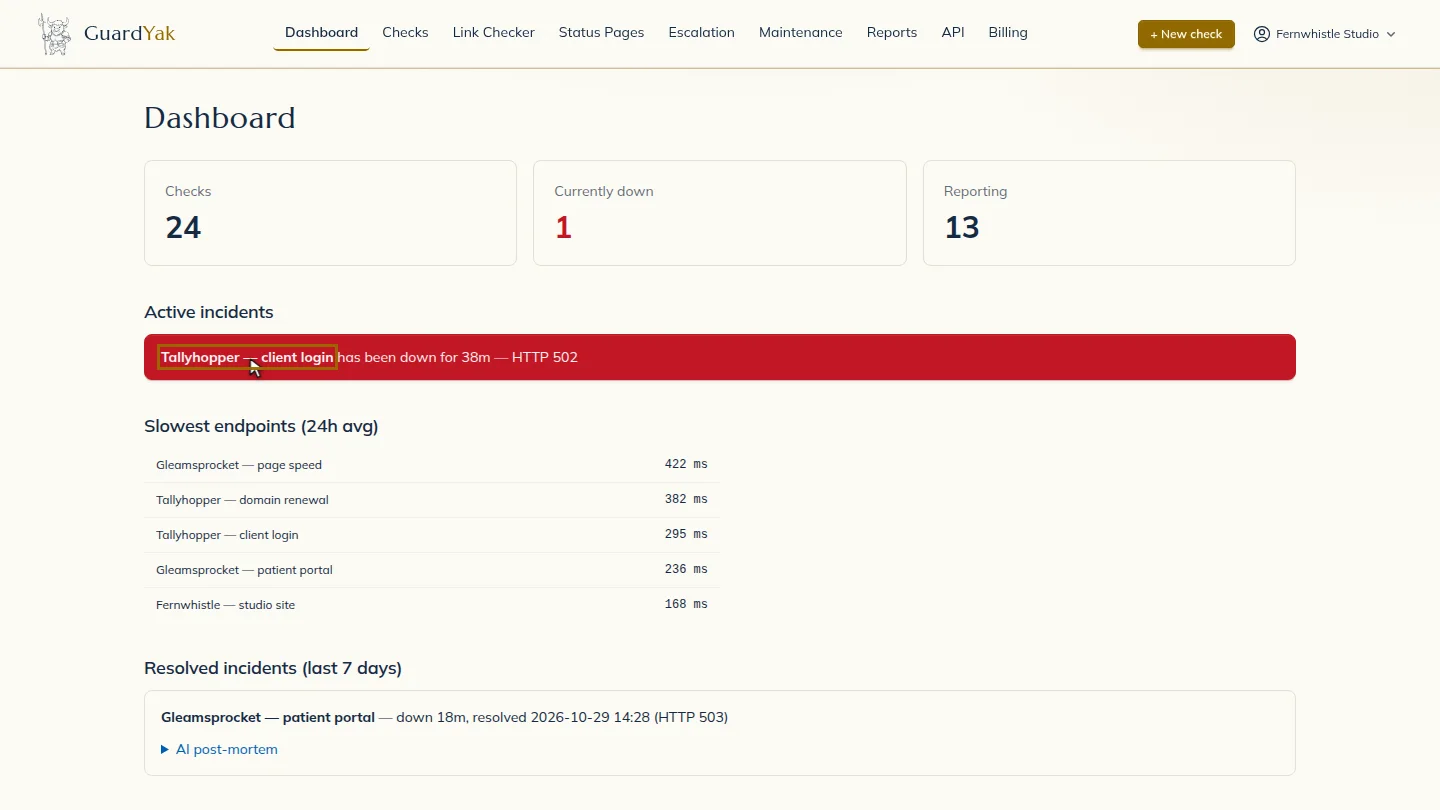
Under Active incidents, the failing check is listed with when it started.
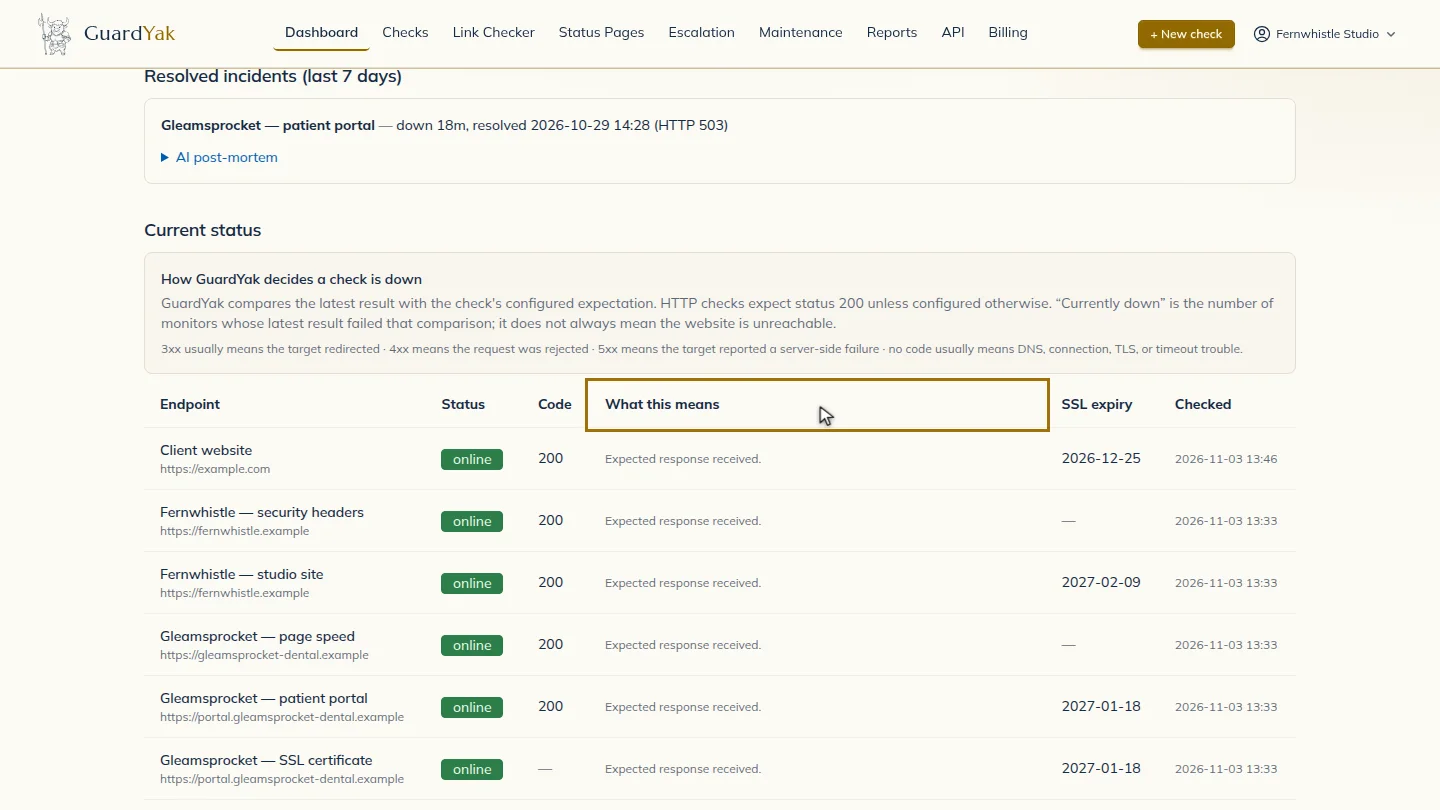
In Current status, read the code and the What this means column. A five-oh-two, for example, means the web server couldn't reach the app behind it.
Steps
Check the summary ▶ 0:07
Open Dashboard. Currently down and Active incidents show the scale of the problem.
Find the open incident ▶ 0:16
Under Active incidents, find the check and when the incident started.
Read what the error means ▶ 0:21
In Current status, compare Status and Code, then read What this means for that row.
Next steps
Updated 2026-10-26
502 error site down why incident status code meaning