How to review uptime history in GuardYak
Clients ask how reliable their site has been. Reports shows each check's uptime percentage and a day-by-day history, so you can answer with numbers and spot patterns such as outages that keep recurring.
Before you start
- Checks that have been running for a few days
Plays silently with captions; the narrated version is on its way.
Transcript
Answer how reliable a site has been with an uptime percentage and a day-by-day history.
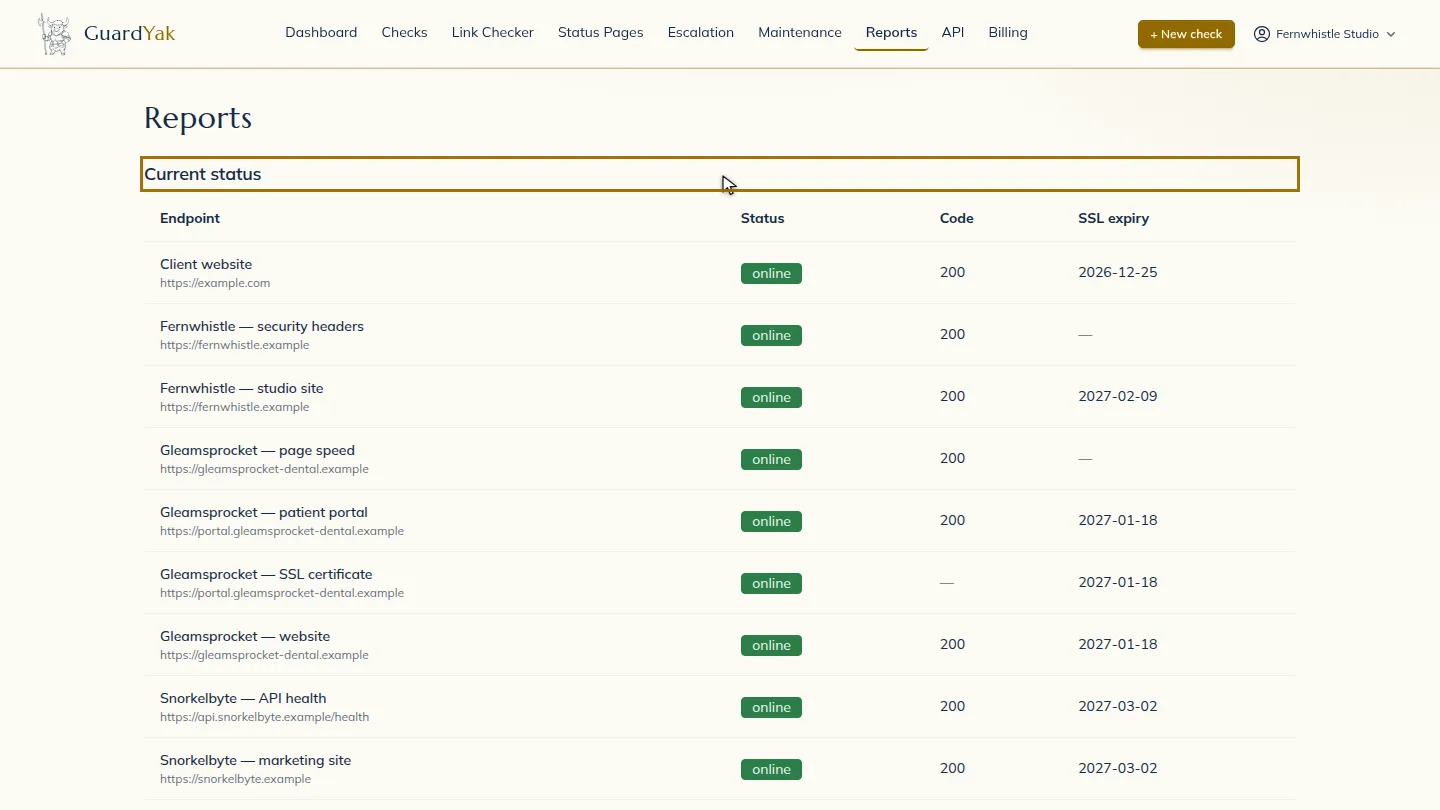
Open Reports. Current status lists every check with its latest status code, and when its SSL certificate expires, so you can renew certificates before visitors see a warning.
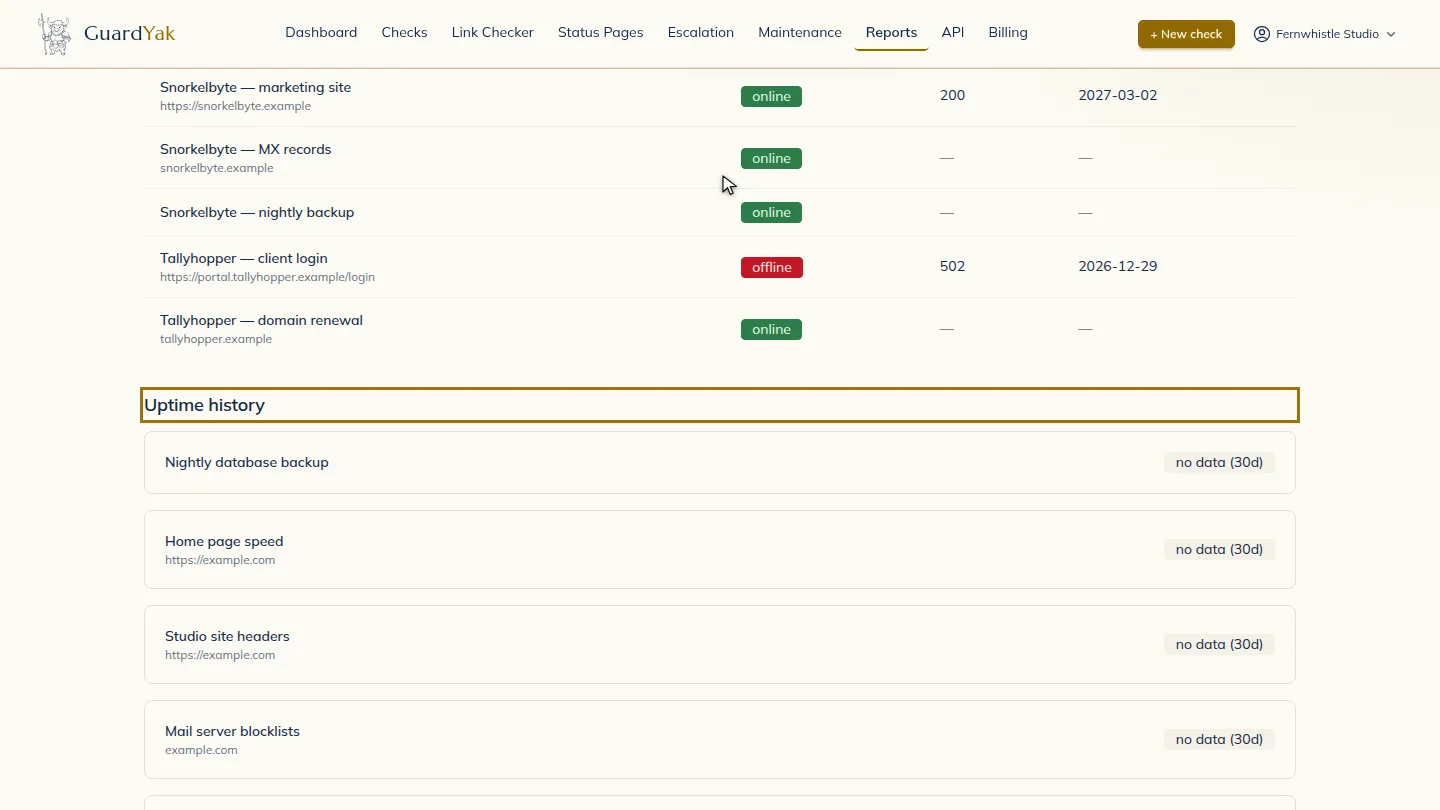
Scroll to Uptime history. Each check has its uptime percentage and a bar for every day, so a bad week stands out. Hover a day to see what happened, then share the numbers in your monthly client report.
Steps
Check current status ▶ 0:07
Open Reports. Current status lists each check's latest Status, Code and SSL expiry.
Read the history ▶ 0:20
Scroll to Uptime history to see each check's uptime percentage and daily bars.
Next steps
Updated 2026-10-26
uptime report sla report availability history