How to monitor an API endpoint in GuardYak
An API can return 200 OK while sending back an error. An API check sends the request you define, with headers and a body if needed, and checks a value in the JSON response, so you hear about an unhealthy service and not only a dead one.
Before you start
- A GuardYak account (every check type is available on the free plan)
Plays silently with captions; the narrated version is on its way.
Transcript
Go beyond 'is it up' and check the API actually answers correctly. Here's how to monitor an API endpoint in GuardYak.
Start a new check and choose API.
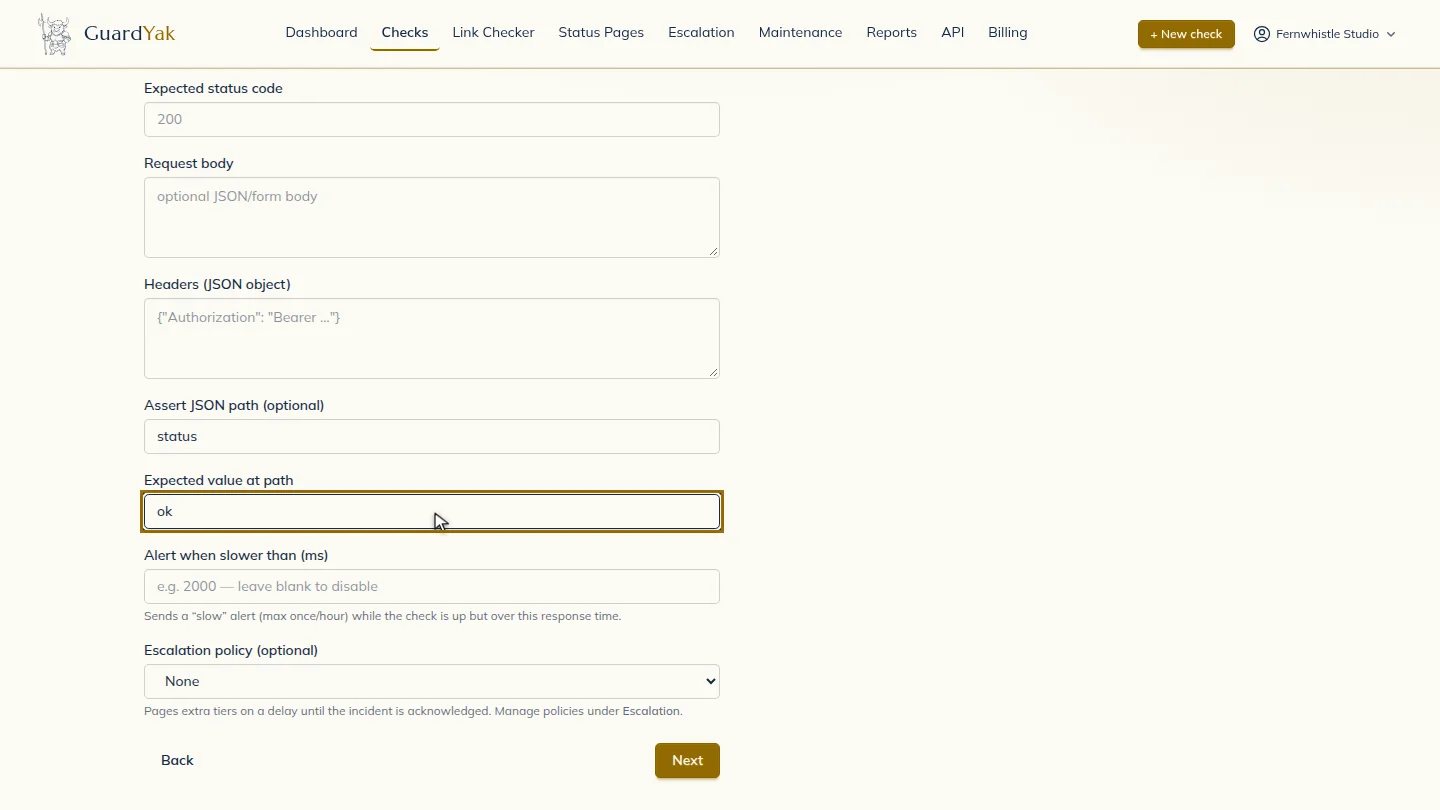
Name the check and paste the endpoint's URL. Then tell GuardYak what a healthy answer looks like: here, the status field must equal OK.
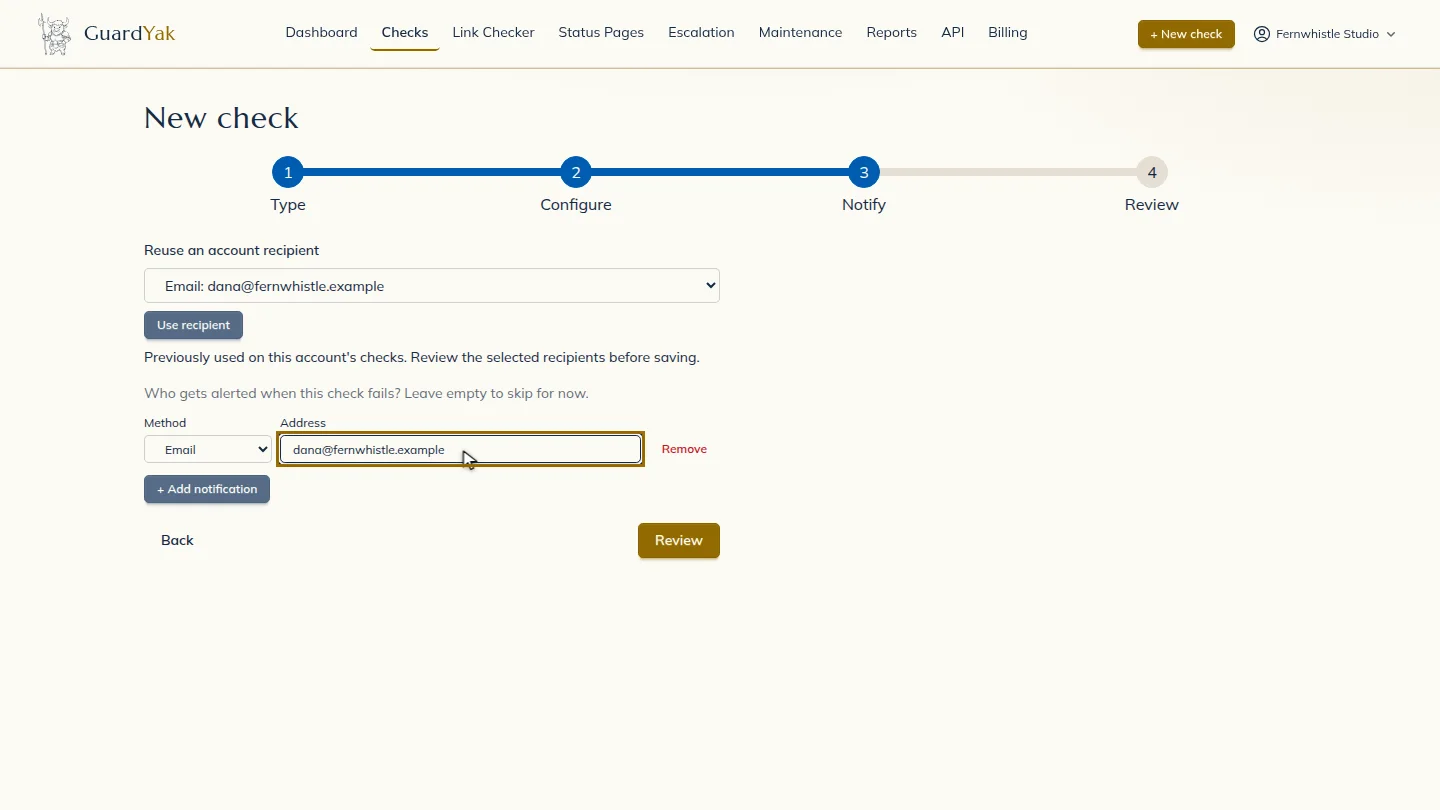
Select Next, then add the email address that should hear about problems.
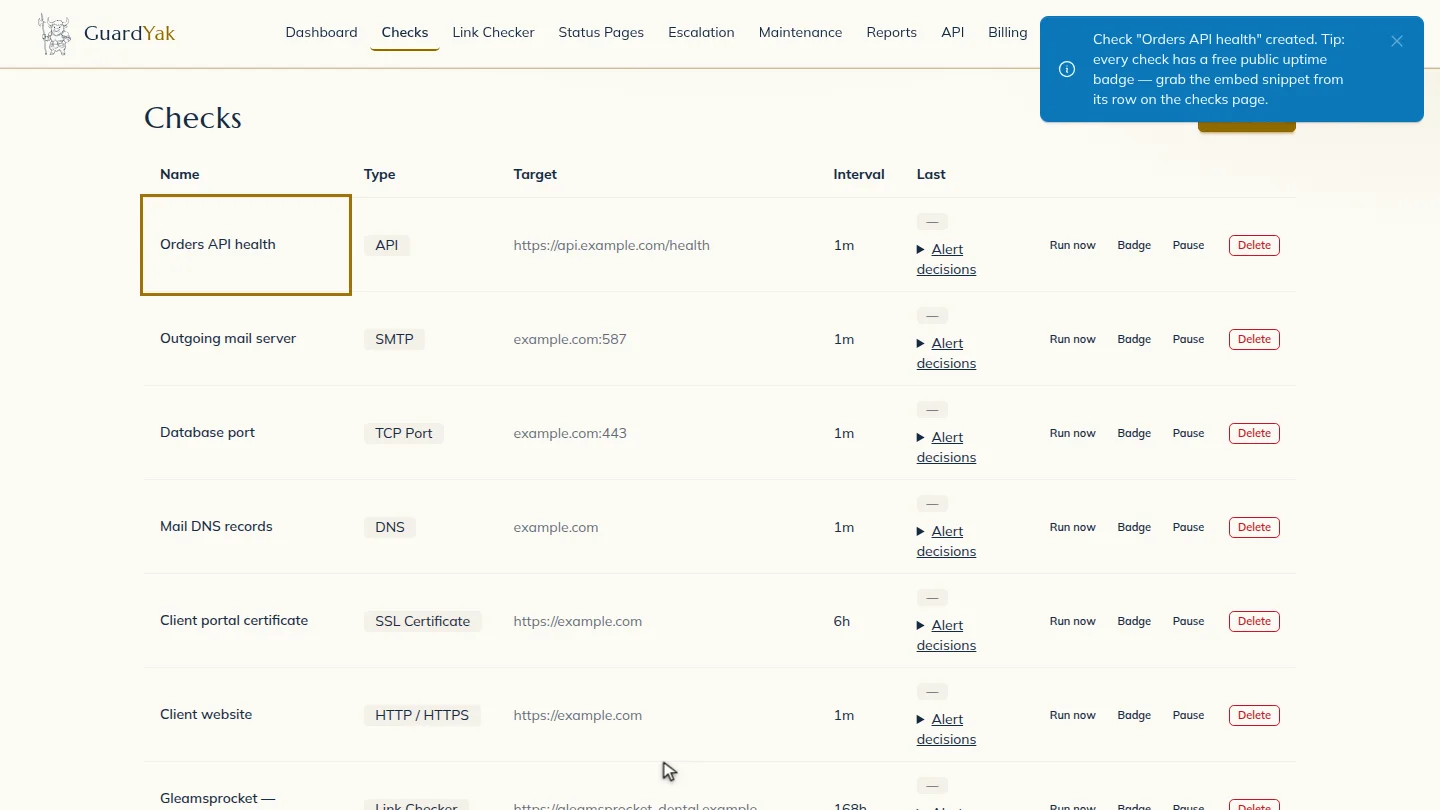
Select Review, check the summary, and create it. The new check joins your list, and GuardYak starts checking on its next run.
Steps
Choose the check type ▶ 0:09
In Checks, select + New check, then select API.
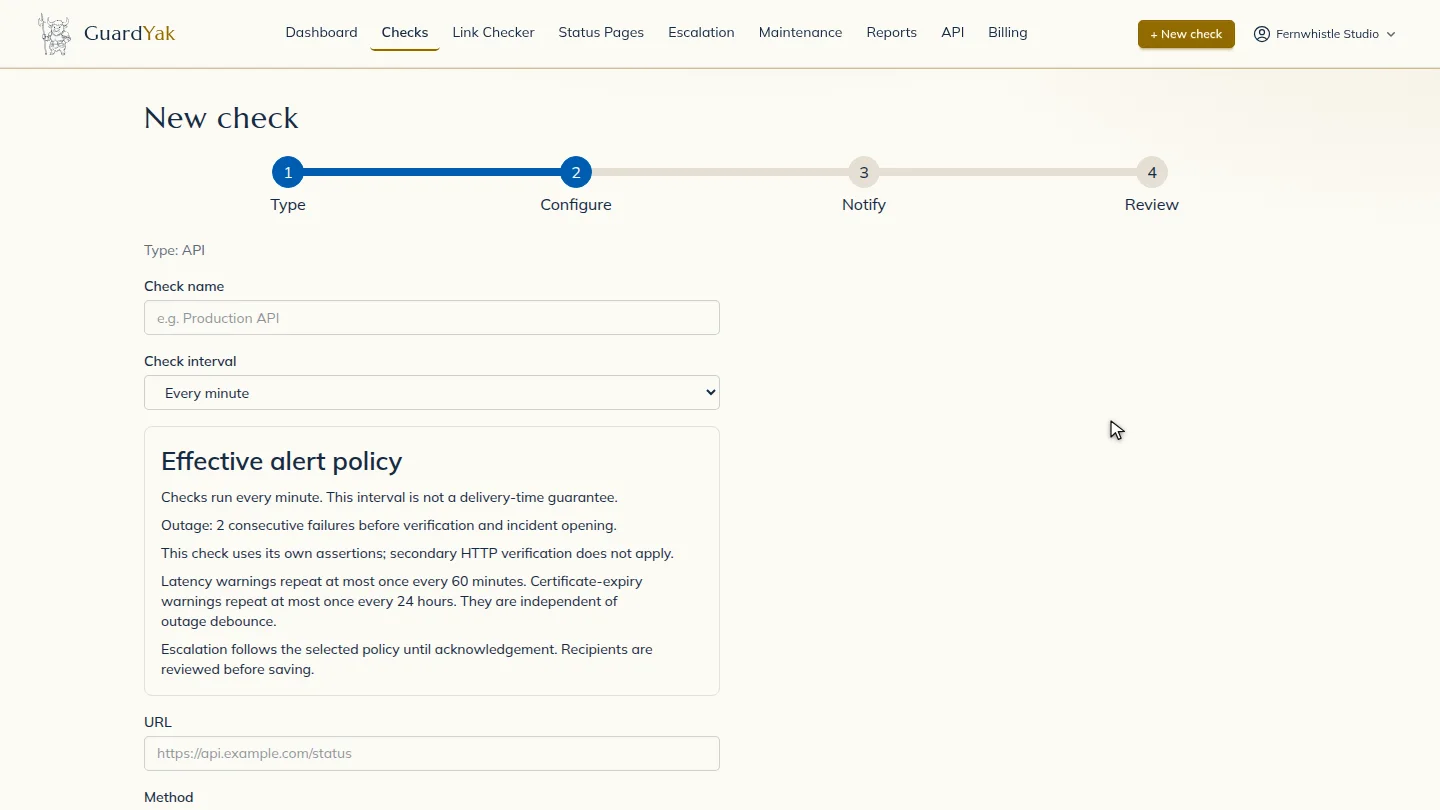
Fill in the details ▶ 0:12
Enter a Check name and the endpoint URL. Add Headers (JSON object) or a Request body if the API needs them, then set Assert JSON path (optional) and Expected value at path.
Choose who gets alerts ▶ 0:22
Select Next. Under Address, enter the email that should receive alerts.
Create the check ▶ 0:28
Select Review, check the summary, then select Create check. The new check appears on Checks.
Next steps
Updated 2026-11-03
api monitoring json assertion rest api uptime health endpoint check